
10 US airports where domestic airfare increased most this year
SmartAsset ranked the 74 largest U.S. airports by passenger volume based on the percent change in domestic fares between Q1 2024 and Q1 2023.
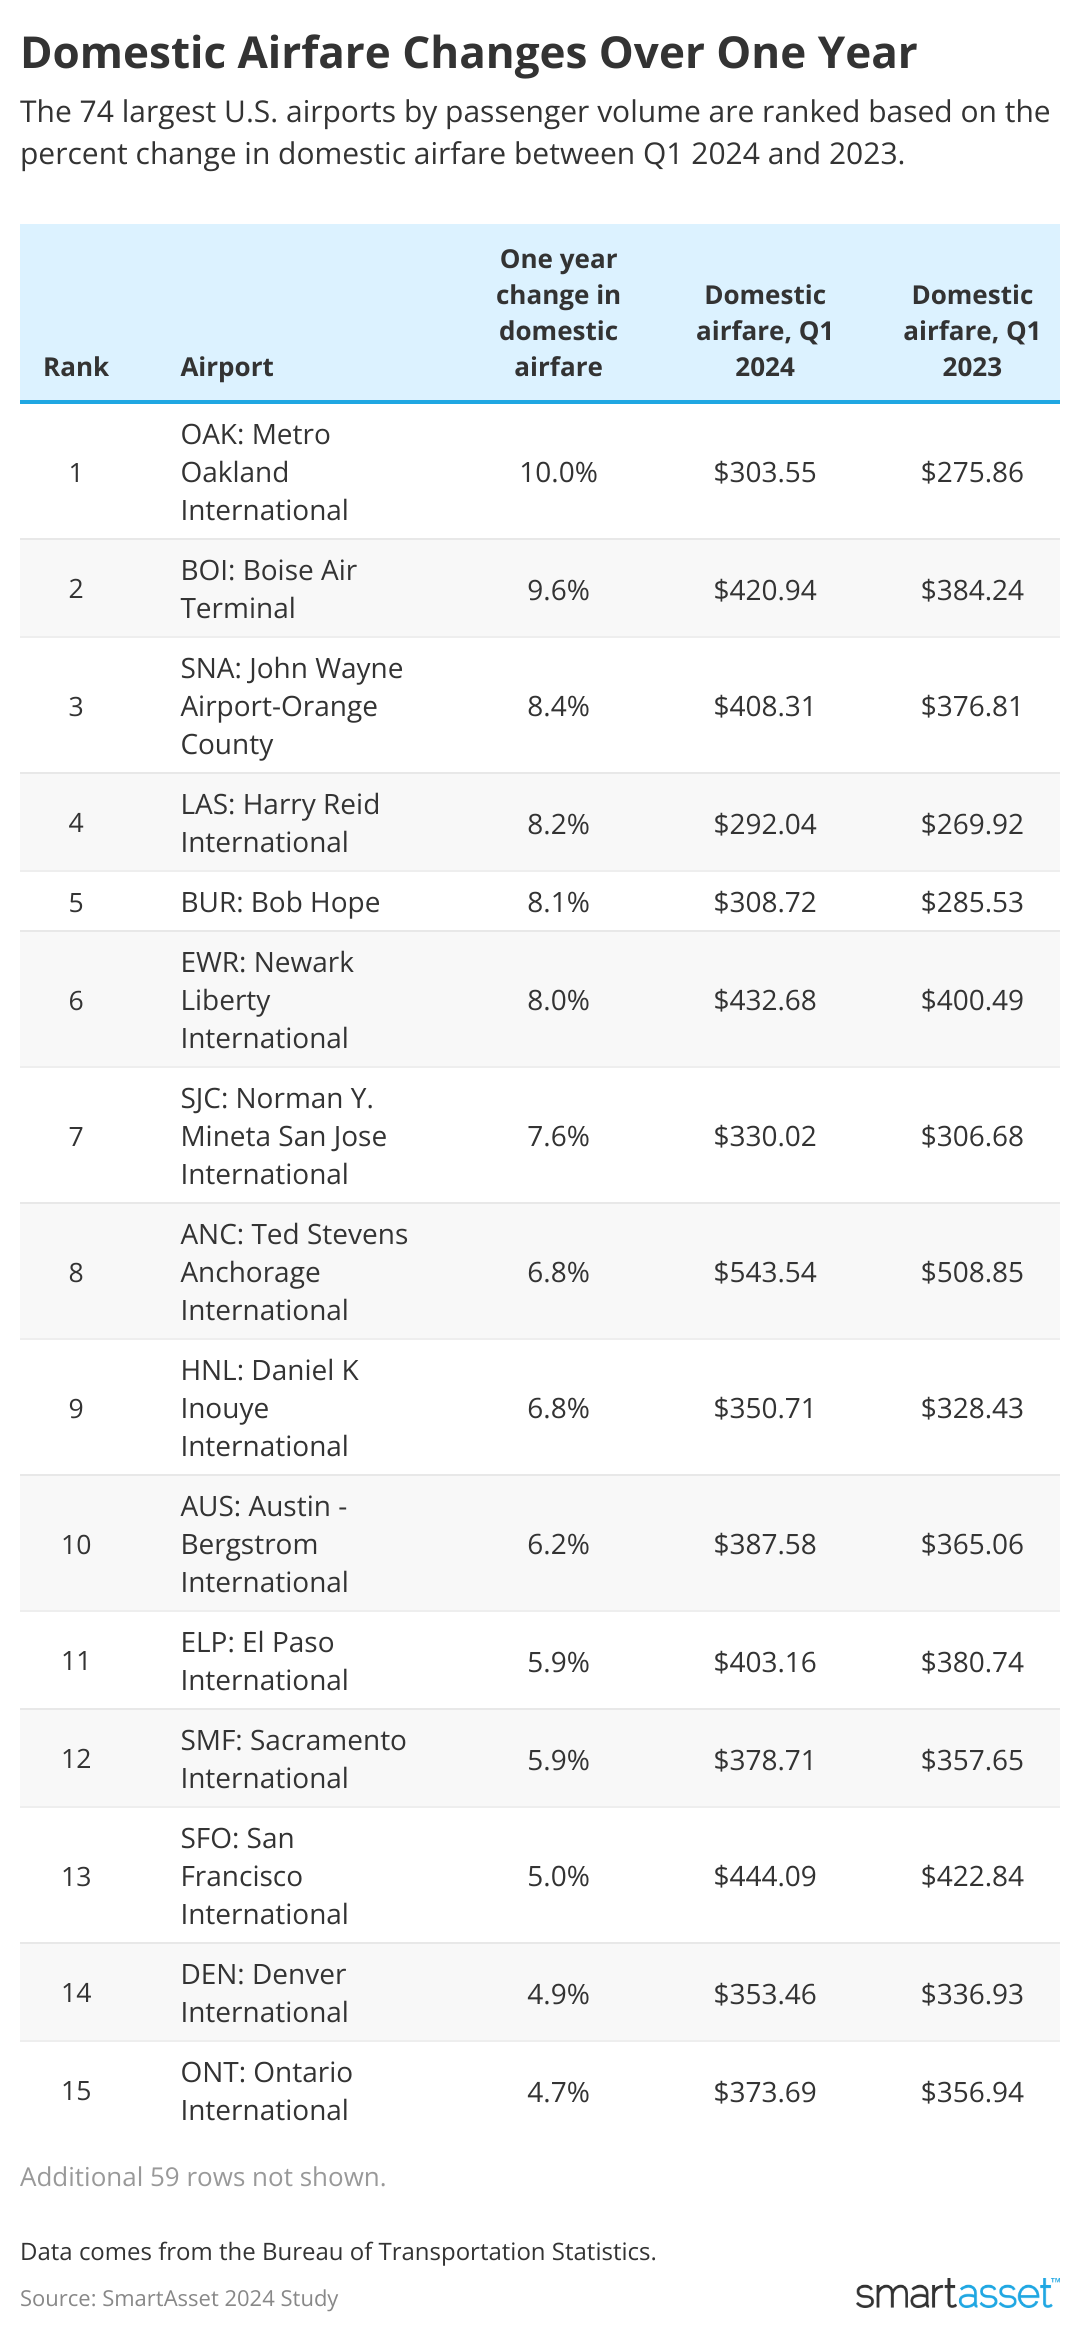
The national average for domestic airfare in early 2024 was $388, up slightly from $381 one year earlier—an increase that didn't even keep pace with inflation. Many major airports also saw domestic airfare prices cool, leaving more room in the budget for some travelers. But depending on their location, others may have to reconsider their budgets for the upcoming travel season, as certain major airports continued to see price hikes as high as 10%.
With this in mind, SmartAsset ranked the 74 largest U.S. airports by passenger volume based on the percent change in domestic fares between Q1 2024 and Q1 2023.
Key Findings
- Airfare increased by 10% year over year at this California airport. Metro Oakland International Airport in Oakland, CA saw domestic airfare increase to $304 in 2024, from $276 one year prior. Meanwhile, flights out of San Francisco International increased by half as much at 5% (13th largest increase studywide), but are more expensive at an average of $444.
- Flights out of Florida got up to 9% cheaper. Southwest Florida International Airport saw the biggest price decrease at 8.9% from $369 last year to $336 in 2024. Also in the top five biggest decreases were Fort Lauderdale-Hollywood International Airport (-6%), Palm Beach International Airport (-5.5%) and Miami International (-4.9%). Overall, domestic airfare at 20 major airports got cheaper this year.
- Newark Liberty International airfare increased more than 30% over two years. Ranking sixth overall this year with an 8% increase in fares to $433, EWR saw the largest two-year increase studywide. Airfare was $331 out of Newark in Q1 2022. Meanwhile, neighboring John F. Kennedy International Airport saw the third-largest two-year increase at 27%. But JFK ranked 16th overall this year with a modest 4.7% increase.
- Flights are the most expensive out of these three airports. Getting out of Ted Stevens Anchorage International in Alaska will cost you an average of $544 in 2024. ANC ranked eighth with a 6.8% one-year increase. Washington Dulles International in Washington, D.C. has an average fare of $496 after a 1.7% increase. Third-most expensive are flights out of Detroit Metro Wayne County in Michigan, with a 1.9% increase culminating in a $456 average fare.
Airports With the 10 Highest Increases in Domestic Airfare
Major airports are ranked by the percent increase in domestic airfare between 2023 and 2024.
- OAK: Metro Oakland International (Oakland, CA)
- One-year airfare change: 10.04%
- Average domestic airfare (2024): $303.55
- Average domestic airfare (2023): $275.86
- Average domestic airfare (2022): $261.97
- Two-year airfare change: 15.87%
- Number of passengers in 2023: 268,118
- BOI: Boise Air Terminal (Boise, ID)
- One-year airfare change: 9.55%
- Average domestic airfare (2024): $420.94
- Average domestic airfare (2023): $384.24
- Average domestic airfare (2022): $358.01
- Two-year airfare change: 17.58%
- Number of passengers in 2023: 127,913
- SNA: John Wayne Airport-Orange County (Santa Ana, CA)
- One-year airfare change: 8.36%
- Average domestic airfare (2024): $408.31
- Average domestic airfare (2023): $376.81
- Average domestic airfare (2022): $326.68
- Two-year airfare change: 24.99%
- Number of passengers in 2023: 268,194
- LAS: Harry Reid International (Las Vegas, NV)
- One-year airfare change: 8.20%
- Average domestic airfare (2024): $292.04
- Average domestic airfare (2023): $269.92
- Average domestic airfare (2022): $239.77
- Two-year airfare change: 21.80%
- Number of passengers in 2023: 672,945
- BUR: Bob Hope (Burbank, CA)
- One-year airfare change: 8.12%
- Average domestic airfare (2024): $308.72
- Average domestic airfare (2023): $285.53
- Average domestic airfare (2022): $242.03
- Two-year airfare change: 27.55%
- Number of passengers in 2023: 166,485
- EWR: Newark Liberty International (Newark, NJ)
- One-year airfare change: 8.04%
- Average domestic airfare (2024): $432.68
- Average domestic airfare (2023): $400.49
- Average domestic airfare (2022): $331.40
- Two-year airfare change: 30.56%
- Number of passengers in 2023: 930,056
- SJC: Norman Y. Mineta San Jose International (San Jose, CA)
- One-year airfare change: 7.61%
- Average domestic airfare (2024): $330.02
- Average domestic airfare (2023): $306.68
- Average domestic airfare (2022): $286.29
- Two-year airfare change: 15.27%
- Number of passengers in 2023: 293,529
- ANC: Ted Stevens Anchorage International (Anchorage, AK)
- One-year airfare change: 6.82%
- Average domestic airfare (2024): $543.54
- Average domestic airfare (2023): $508.85
- Average domestic airfare (2022): $455.92
- Two-year airfare change: 19.22%
- Number of passengers in 2023: 110,792
- HNL: Daniel K. Inouye International (Honolulu, HI)
- One-year airfare change: 6.78%
- Average domestic airfare (2024): $350.71
- Average domestic airfare (2023): $328.43
- Average domestic airfare (2022): $309.68
- Two-year airfare change: 13.25%
- Number of passengers in 2023: 343,489
- AUS: Austin - Bergstrom International (Austin, TX)
- One-year airfare change: 6.17%
- Average domestic airfare (2024): $387.58
- Average domestic airfare (2023): $365.06
- Average domestic airfare (2022): $317.41
- Two-year airfare change: 22.11%
- Number of passengers in 2023: 468,640
Data and Methodology
SmartAsset reviewed data for 74 U.S. airports that served 100,000 or more passengers in 2023. Airports were ranked based on the percent change in the average domestic airfare price between Q1 2024 and Q1 2023, from the most recent data available from the Bureau of Transportation Statistics. The two-year airfare changes were also found by comparing prices from Q1 2022.
This story was produced by SmartAsset and reviewed and distributed by Stacker Media.


