If you’ve tried this and still can’t sign in, contact your local office or email info@richardsonmediagroup.net.

Self-employed earnings fall short of homebuying needs in 22 of 23 major metros


Median earnings for incorporated self-employed workers are below a single-income homebuying benchmark in 22 of 23 metros, with six-figure gaps in San Diego, Seattle, and Boston and an even wider divide for unincorporated self-employed workers, according to a Griffin Funding analysis of 2025 Census ACS 1-Year estimates and June 2026 Redfin affordability data.
For millions of Americans who work for themselves, earning a good living and being able to afford a home are two different things. In nearly every major metro analyzed, the typical earnings of an incorporated self-employed worker fell short of the income needed for one person to afford a typical home. Griffin Funding, a San Diego-based mortgage lender, compared 2025 Census earnings data for full-time, year-round incorporated self-employed workers with Redfin’s June 2026 estimate of the income needed to afford a typical home across 23 major U.S. metros.
In 22 of the 23 metros, median incorporated self-employed earnings fell below the homebuying benchmark. Sixteen markets were at least $25,000 short, seven were at least $50,000 short, and San Diego, Seattle, and Boston had six-figure gaps. For people who work for themselves, location can change how far the same kind of income goes toward buying a home.
How this was analyzed: The study compares 2025 ACS 1-Year median earnings for full-time, year-round incorporated self-employed workers with Redfin’s June 2026 metro-level income needed to afford a typical home. It is a single-income affordability comparison, not a measure of household affordability or mortgage qualification.
How far self-employed earnings stretch in 23 major metros
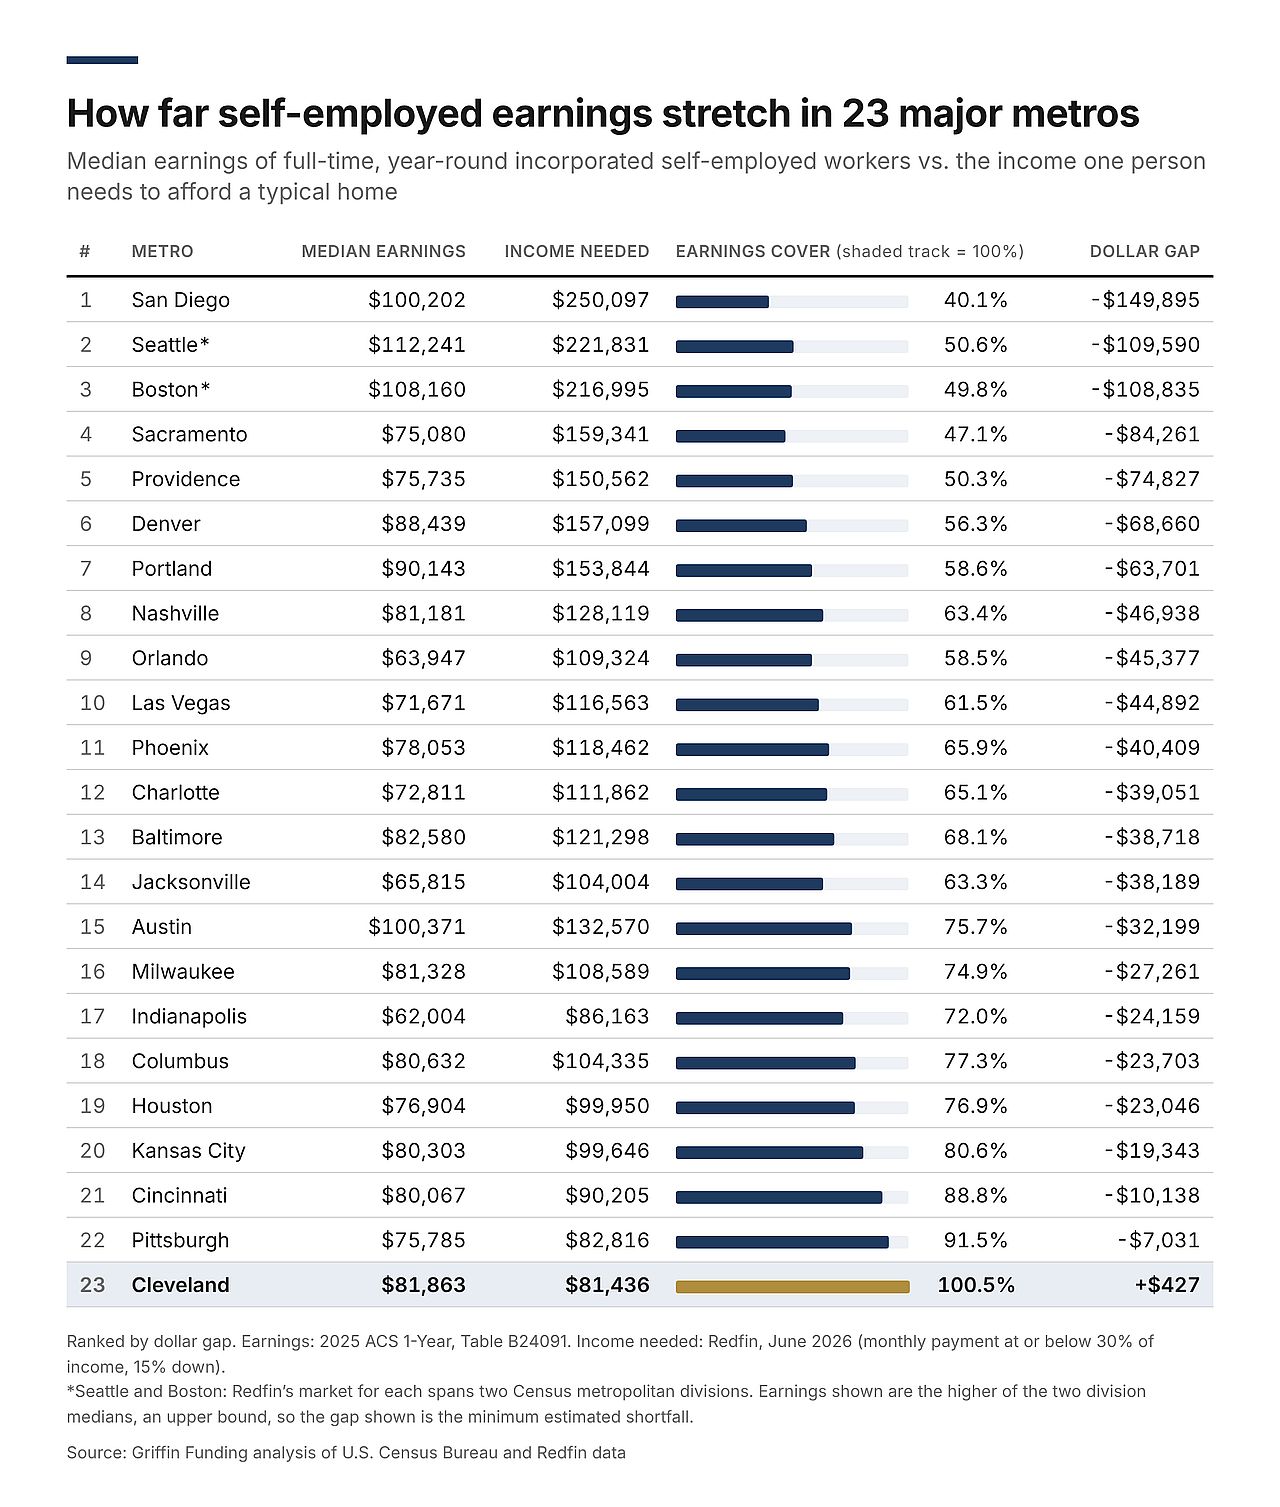
Note: The dollar gap equals median incorporated self-employed earnings minus the estimated income needed for a single earner to afford the typical home. A negative value represents a shortfall. Earnings coverage shows the share of required income represented by median earnings.
San Diego is the extreme case
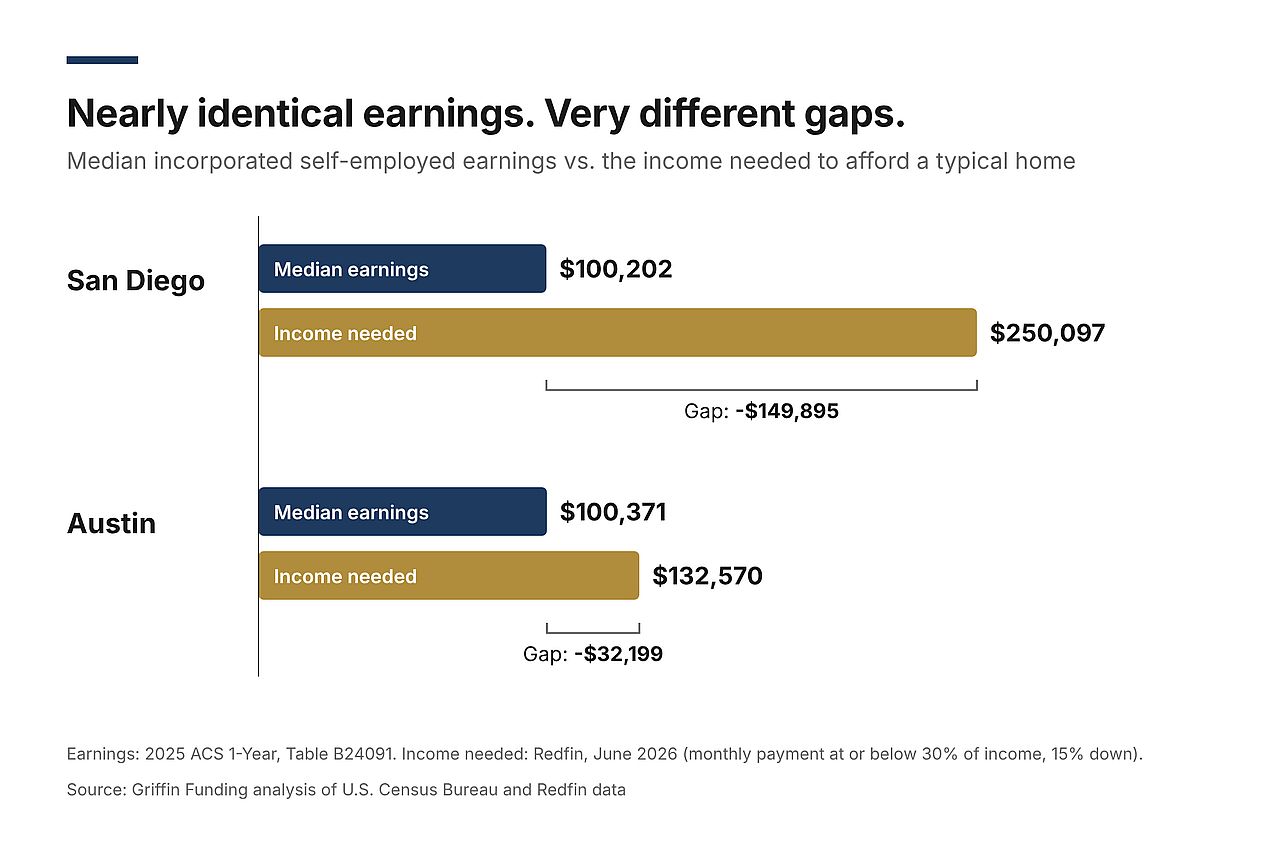
A self-employed business owner earning a solid income might expect it to put homeownership within reach. In San Diego, it doesn’t come close. San Diego had the largest dollar gap in the analysis. Median incorporated self-employed earnings were $100,202, compared with $250,097 in income needed to afford the typical home. That leaves a $149,895 shortfall. For every $1 of income needed to afford a typical San Diego home, median incorporated self-employed earnings provided about 40 cents.
Seattle and Boston were the only other markets with six-figure shortfalls, with minimum estimated gaps of $109,590 in Seattle and $108,835 in Boston. Earnings alone don’t explain the gap. Median incorporated earnings in Austin were $100,371, almost the same as in San Diego, yet Austin’s shortfall was $32,199. A business owner can earn more in one city than another and still be further from affording a home.
Cleveland and Pittsburgh come closest to the affordability benchmark
Cleveland had the only median-earnings point estimate above the affordability benchmark, and only barely. Median incorporated self-employed earnings were $81,863, compared with $81,436 in income needed, a difference of $427.
Pittsburgh was the next closest. Median incorporated self-employed earnings of $75,785 were $7,031, or about 8.5%, below the $82,816 benchmark. ACS estimates carry sampling error, though, and the margins of error for both Cleveland and Pittsburgh overlap their benchmarks. Neither market’s earnings estimate is statistically different from its benchmark at the 90% confidence level the Census Bureau uses.
Cincinnati was $10,138 below the benchmark. Even accounting for its ACS margin of error, its earnings estimate remained below the required-income figure.
Unincorporated self-employed workers face an even wider gap in every market analyzed
The numbers are lower still for another Census category that includes people who are self-employed in unincorporated businesses as well as unpaid family workers. Across all 23 metros, median earnings for this group were lower than incorporated self-employed earnings and therefore covered a smaller share of the same single-income homebuying benchmark.
San Diego shows just how wide that divide can become. Median incorporated self-employed earnings were $100,202, while median unincorporated self-employed earnings were $46,985. Against the same $250,097 affordability benchmark, incorporated earnings covered 40.1% of the income needed, while unincorporated earnings covered just 18.8%.
The pattern holds even in Cleveland, the one market where the incorporated estimate clears the benchmark. Median unincorporated self-employed earnings there were $51,705, covering about 63.5% of the same $81,436 benchmark.
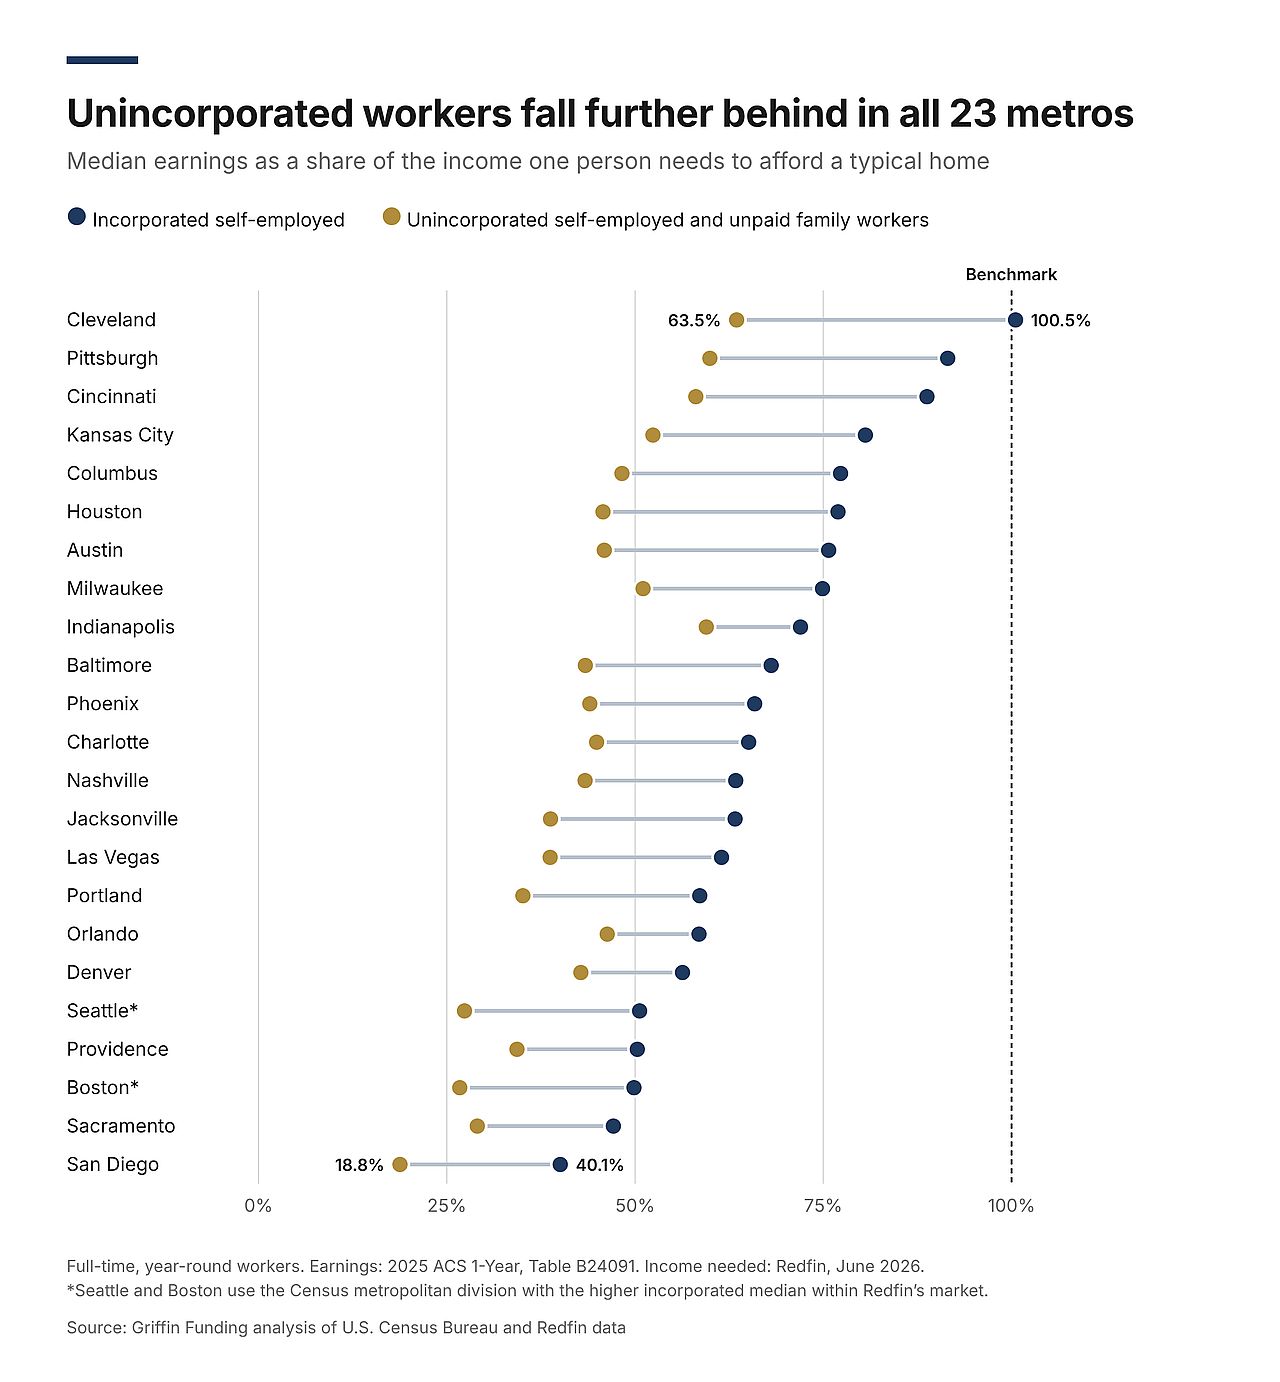
This matters because “self-employed” can sound like a single type of worker. In reality, it includes people running businesses with very different structures, earnings and financial circumstances, and the homebuying picture can look very different within that group. The comparison does not mean that incorporating a business causes higher earnings or improves homebuying affordability. The two populations can differ by occupation, industry, business maturity and other characteristics. Instead, the finding shows how much financial circumstances can vary within the broad category of workers described as self-employed.
What those numbers can look like for an individual borrower
Population-level data can show the size of the affordability problem, but it cannot capture every self-employed borrower’s financial life. Two people categorized as self-employed may earn money in very different ways. Income can fluctuate from month to month, move through multiple business accounts, or look different on tax documents than it does in a business’s actual deposit history.
Some borrowers also face the challenge of documenting enough qualifying income to obtain financing. For business owners whose tax returns reflect substantial business deductions, the income used in traditional mortgage underwriting may look very different from the cash flow moving through their business.
Affordability and mortgage qualification are different questions
Census earnings are population-level statistics, not mortgage-underwriting income, and the analysis does not account for a spouse or partner’s income, assets, debts, credit, down payment, or the mortgage program used. The study measures how one median self-employed income compares with a standardized local homebuying benchmark.
For self-employed borrowers, the distinction can be especially important. Traditional mortgage programs may rely on tax documentation to establish qualifying income, while some borrowers use bank statement loans that evaluate qualifying bank deposits instead. Bank statement mortgages are a type of non-QM loan, a category of more flexible mortgages that can rely on alternative documentation or underwriting for borrowers who don’t meet typical qualified-mortgage criteria.
That means a self-employed buyer can face two separate questions on the path to homeownership: Does their income provide enough buying power for the home they want? And can they document enough qualifying income under the mortgage program they are using?
Across the 23 metros analyzed, the numbers point to a housing market where earning a solid living does not necessarily translate into being able to buy a typical home. For self-employed Americans, that challenge can be compounded by the way their income is earned and documented. The path to homeownership can depend not only on how much someone earns, but where they live and how that income is reflected on paper.
Methodology
To measure how far self-employed earnings stretch toward buying a home, Griffin Funding compared 2025 ACS 1-Year median earnings from the U.S. Census Bureau with Redfin’s June 2026 estimate of the income needed to afford a typical home across 23 matched U.S. metropolitan areas. Self-employment earnings came from Census Detailed Table B24091. The primary analysis uses median earnings for full-time, year-round workers who are self-employed in their own incorporated businesses. We also analyzed the Census category covering workers who are self-employed in unincorporated businesses and unpaid family workers to see how affordability differed within the broader self-employed population.
ACS estimates are subject to sampling error, and the Census Bureau publishes margins of error at the 90% confidence level. Griffin Funding reviewed those margins for the self-employment earnings estimates. Treating Redfin’s benchmark as a fixed figure, Cleveland and Pittsburgh were the only markets where the incorporated earnings margin of error overlapped the benchmark. San Antonio was excluded because the margin of error on its incorporated self-employed earnings estimate was more than 30% of the estimate itself.
Redfin considers a home affordable when a buyer would spend no more than 30% of their income on the monthly housing payment. Its estimate uses median sale prices, prevailing mortgage rates and property taxes, and assumes a 15% down payment. Griffin Funding used Redfin’s published required-income figure for each metro rather than recreating its affordability model, and calculated the difference between median self-employed earnings and that figure for each market. Markets were included only when Redfin published a June 2026 estimate for the metro.
Griffin Funding matched geographies using Redfin’s published metro-county crosswalk and the Census Bureau’s 2023 metro area definitions, which the 2025 ACS uses. Two markets needed adjustment. Redfin’s Seattle market covers King and Snohomish counties, while the Census Seattle metro area also includes Pierce County. Redfin’s Boston market covers Essex, Middlesex, Norfolk, Plymouth and Suffolk counties, while the Census Boston metro area also includes Rockingham and Strafford counties in New Hampshire. Each of those Redfin markets is made up of exactly two Census metropolitan divisions, so its combined median should fall between the two division medians. Griffin Funding used the higher published division median for each, which gives a conservative estimated shortfall. In Cleveland, Pittsburgh, Nashville, Houston, Indianapolis and Cincinnati, the two county lists differ slightly, by counties that account for less than 5% of each metro’s population. Those comparisons are approximate, and Griffin Funding did not measure how the boundary differences affect median earnings.
Census earnings cover the 12 months before each 2025 survey response and are reported in 2025 dollars. Griffin Funding did not adjust them forward to June 2026, the month Redfin’s housing costs reflect. If self-employed earnings rose between 2025 and mid-2026, the gaps would be somewhat smaller than shown.
This analysis measures single-income housing affordability, not mortgage eligibility or individual buying power. Actual affordability and qualification can vary based on household income, assets, debts, credit, down payment, loan program and other borrower-specific factors.
This story was produced by Griffin Funding and reviewed and distributed by Stacker.


